Automated Unit Test Code Coverage Tools for .NET (2025)

In researching some tools, I came across TUnit- a newer .NET test framework that runs on the Microsoft Testing Platform (MTP) and is AOT Compatible. It emphasizes extensibility and performance. TUnit’s NuGet market share is still small compared to xUnit, NUnit, and MSTest, which makes total sense. But it is important to note that TUnit’s use of MTP affects how you collect code coverage. This lead to me asking, “What is being used for Automated Unit Test Code Coverage today?”
Unit test code coverage measures the proportion of your production code executed by your automated tests. It does not measure test quality, defect risk, security or complexity. Coverage can be useful for finding areas that have been neglected in your testing, but Goodhart’s Law applies (When a measure becomes a target, it ceases to be a good measure.). High coverage can exist with poor assertions, which is why mutation testing with Stryker is a strong companion to coverage.
Where TUnit fits among C# test frameworks
Many posts and threads claim xUnit exceeds NUnit in popularity. A safe, objective signal is NuGet download volume, where xUnit’s totals are higher than NUnit. Just remember NuGet counts restores at the endpoint and can be inflated by CI. It is not a one-to-one proxy for projects.
Framework snapshot
| Framework | NuGet package | NuGet Counts |
| xUnit | xunit | 134.8 K |
| NUnit | NUnit | 95.9 K |
| MSTest | MSTest.TestFramework | 108.2 K |
| TUnit | TUnit | 1.2 K |
What “unit test code coverage” is and is not
Coverage tools mark the lines, branches, or methods executed during your test run and can color those in your editor and in HTML or Cobertura reports. This helps you spot untested branches quickly. Coverage does not score assertion quality or mutation resistance. For that, check out my thoughts on Stryker.NET.
Local code coverage tools you can use today
The focus here is quick developer-local feedback in the IDE.
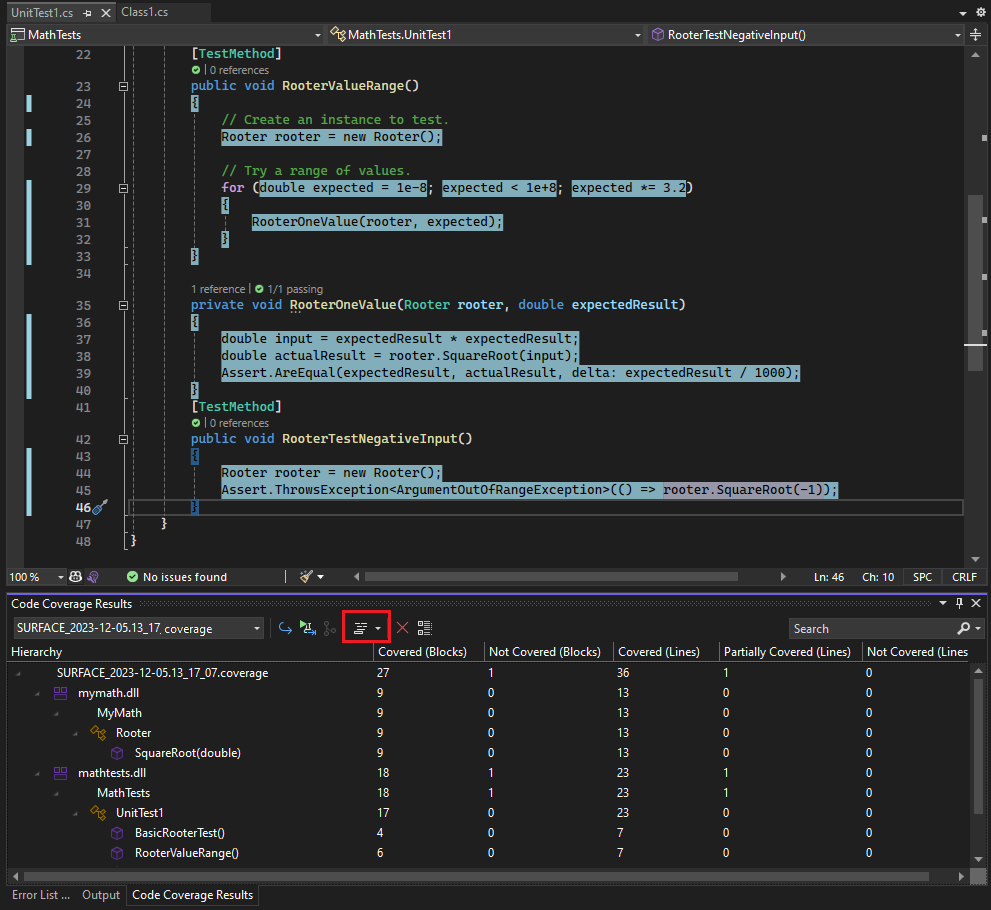
Visual Studio built-in code coverage
Visual Studio 2022 now offers integrated code coverage in Community, Professional, and Enterprise, with collection through the Microsoft Code Coverage engine and the dotnet-coverage tooling. It plugs into Test Explorer and works across frameworks supported by VSTest or MTP.
Quick CLI reference for local runs:
dotnet test -- collect: "XPlat Code Coverage"
That works and gives you an XML file to look at, which you need another tool to absorb its information, but it just seems like a lot of extra steps. I want what they have built right into the IDE.
With Visual Studio Enterprise, you get a nice UI that plugs right into the test runner that most people are using. Visual Studio Enterprise is the most seamless, painless way of running. But Enterprise is expensive and not everyone has access to it.
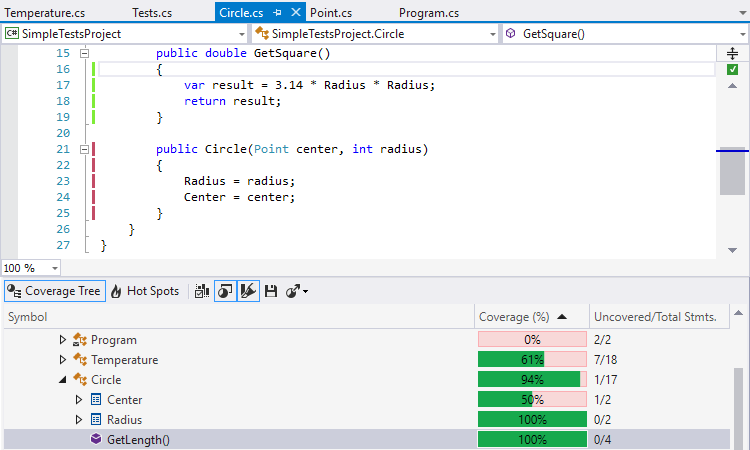
JetBrains dotCover (ReSharper and Rider)
I know that dotCover isn't free either, and I know that JetBrains hasn't been as popular as VisualStudio's Intellisense has gotten smarter and smarter. But I still use it, and I love it. dotCover is built on top of ReSharper, and plugs into the ReSharper Test Runner, much like Microsoft's is built in. What I love about dotCover is that it can run the dirty tests as you hit save. For example, say you're modifying a few lines of code that are covered by 10 tests. Once you hit save, continuous testing will execute just those 10 tests that are "dirty", and give you feedback quickly. So if the idea is to find your broken unit test earlier, the cheaper it is to fix—what could be faster than when you hit save? Maybe that tUnit tool? We'll look at that some other day.
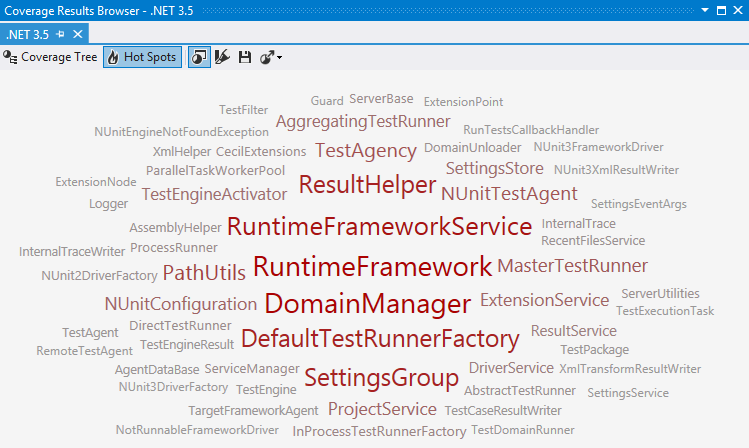
Another great tool that I like is the Hot Spots cloud. JetBrains will generate a word cloud of methods that are high in cyclomatic complexity and low code coverage. This is great when you want to jump into a new project and evaluate what is really going on. It also helps highlight areas that need attention first when you take on a new project that you're trying to improve.
These toolsets are available in Rider as well, which when I did use it, felt like a superior tool to Visual Studio, but it is time for a revisit in that.
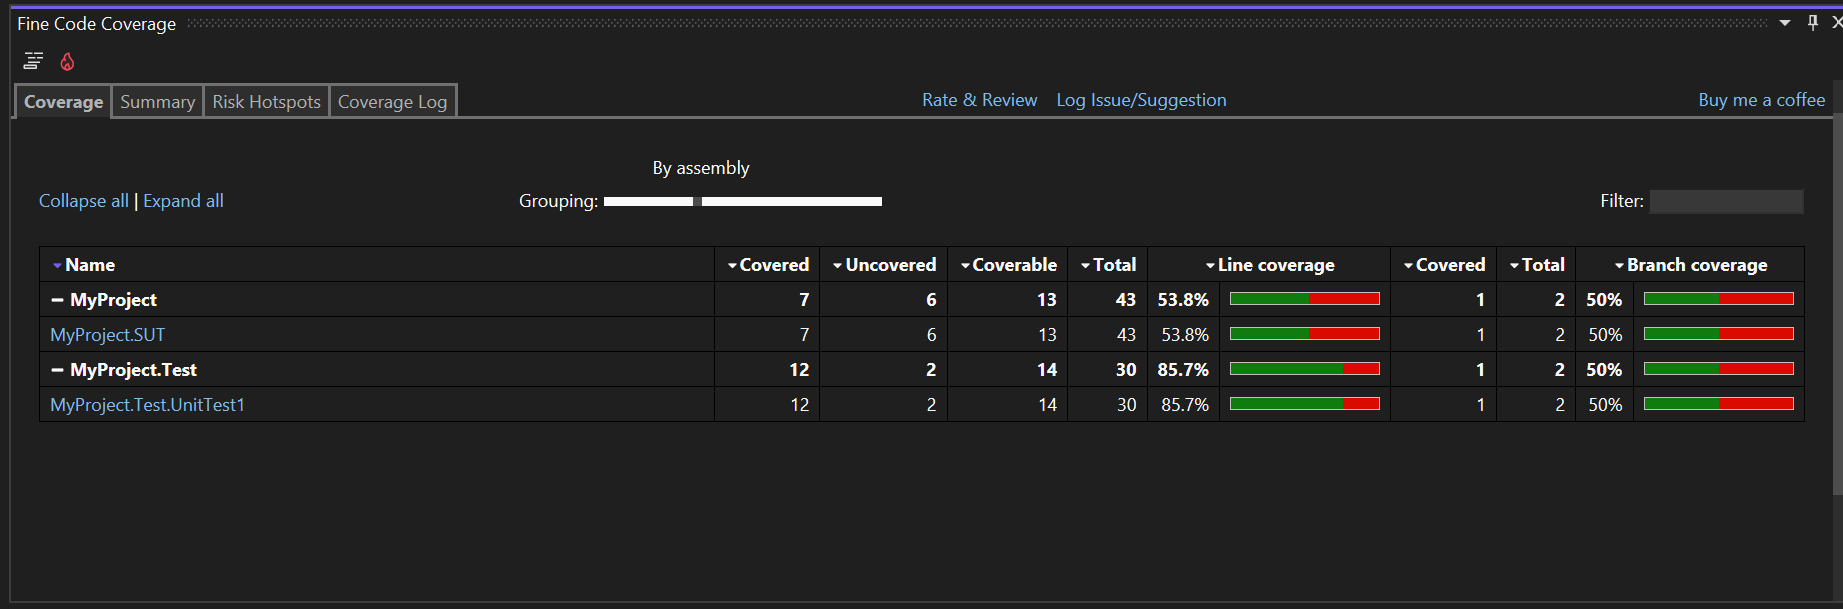
Fine Code Coverage (Visual Studio extension, free)
Fine Code Coverage (FCC) runs inside Visual Studio and renders coverage in the editor plus a browsable report. FCC supports Microsoft Code Coverage, Coverlet, and OpenCover through ReportGenerator. Recent versions added a path that uses Microsoft’s coverage so you do not need Visual Studio test adapters in many cases. FCC also has “Risk Hotspots” that highlight complex code with low coverage.
This free tool has all of the basics that you would want and is easy to install. You don’t need to run CLI commands, and while it may feel a bit clunkier than others because you need to jump across multiple windows in Visual Studio, I’d still recommend this tool if your budget is a concern.
It doesn't matter much which one you choose, but use something
All of these tools measure coverage and they do it well. None of them will transform your daily workflow. Pick the one that fits your IDE and CI so you will actually use it. Since there is a free option, there is no excuse not to add coverage and improve your tests. Standardizing across the team helps, but choose what supports the way you want your tests to run.